Market dashboard · Personal project · 2026
Borsa
The BIST 100 as one live treemap, stitched together from three free data sources with no API keys.
Why I built it
Numbers going up and down on the stock market, how big the companies are, buying and selling: these things always excited me. So I thought, can’t I make a map myself where every company takes up space by its size, with its daily change on top? And I made it.
After that I thought, I already have the data, so why not add a little quiz page too. It’s a place I can drop into in my free time, and I get to know the market better along the way.
What it shows
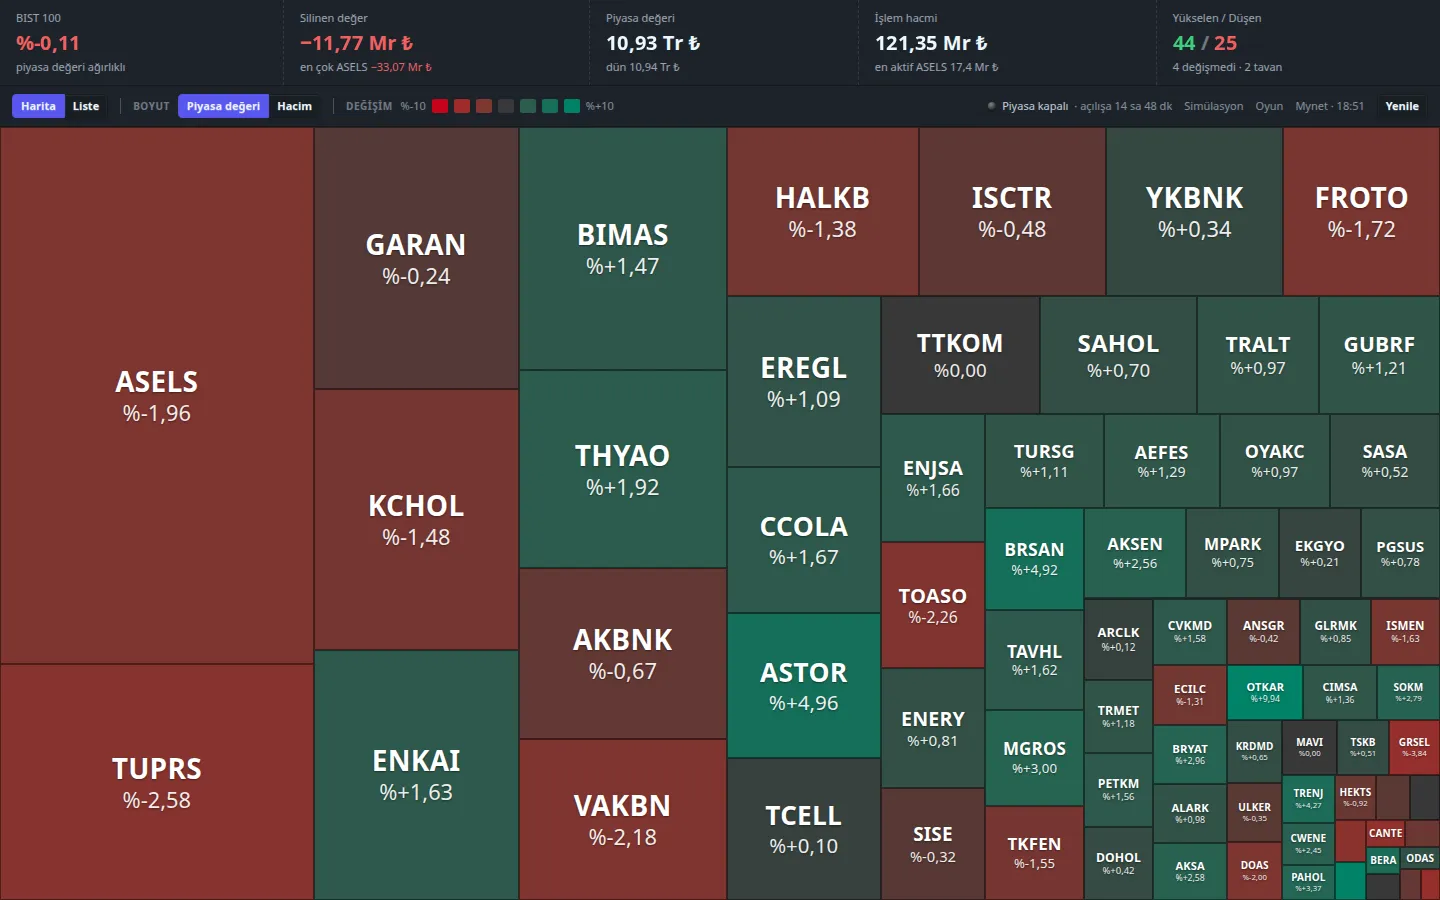
The main board draws the BIST 100 as a treemap: one rectangle per company, its area proportional to market cap, green or red by how far the price has moved since yesterday’s close. Above it sit the index move, how much lira value was added to or wiped off the index today, total turnover, and how many stocks rose or fell.
Clicking a tile opens a stock card: the live price, where today’s move sits in the ±10% daily limit, the company’s share of the index and of today’s move, and a year of price history you can scrub through. The toolbar knows the exchange’s hours, holidays and half days, and counts down to the next open or close. There’s also Hangisi daha büyük?, a game where you pick which of two companies is bigger, and the pairs get closer the longer your streak runs.
Three free sources, no API keys
- Yahoo Finance Primary quotes, as JSON, about 15 minutes delayed.
- if refused
- Mynet Fallback quotes: all 100 stocks scraped from one HTML table.
- if refused
- İş Yatırım Shares outstanding, price history, and last-resort end-of-day quotes.
Market cap is computed as shares × price rather than read as a fixed number, so tiles resize as prices move during the session. Shares are cached for 12 hours and quotes for 60 seconds, and a failed refresh keeps serving the last good values instead of showing an error.
Two bugs worth knowing about
- Yahoo returns HTTP 429 from shared or datacenter IPs. That’s a rate limit on the address, not a broken endpoint: it works from a home connection. When the header says “Mynet”, the fallback did its job.
- İş Yatırım doesn’t return rows in a stable order. The same request comes back in date order only about half the time, so rows are sorted by date before anything reads “the latest close”. Removing that one sort silently produces wrong prices, which is why it has a test.
The treemap
The layout is a squarified treemap (Bruls, Huizing and van Wijk), written as a pure function of the items and the available width and height. It knows nothing about Svelte, so it’s unit-tested directly; the page only measures its container and hands over the numbers.